
It is important that every specialist involved in social media promotion knows how to create a community management report . This document allows for the evaluation of work results based on collected and visually presented indicators.
However, the end of the month can quickly become a nightmare for a social media manager, as you have to prepare a detailed and accurate report on the work carried out. When there are many customers, it becomes a real headache.
However, this work can be simplified and optimized automatically in order to spend little time on it and to focus on analyzing and improving results.
The content of a social media report depends on the defined key tasks, but it has a general structure. In this article, we'll discuss the key indicators of a social media report, its structure, and why you should create a fully automated community management report.
What is a community management report?
A community management report is a document that shows the client the progress of the work done on social media in a practical and understandable format. The report allows you to objectively assess the business results of the collaboration. A competent report from a social media specialist contains key performance indicators for a specific period, conclusions, and an action plan.
Why is it necessary?
The report helps the client see the true picture of what's happening within the communities. The key metrics and figures in the community management report are those included in the social media strategy at the start of the project. This is why the strategy is so important: it contains precise figures and assumptions that we test to achieve the desired result.
What does a community management report look like?
The client receives the report from the social media specialist at the end of each reporting period, it can be sent as a PDF or available online on Google Sheets or Google DataStudio for example.
The document contains the following:
- Goals and objectives set for the current reporting period
- Main community statistics for the period
- Content statistics
- Targeted advertising statistics
- Community audience data, subscriber comments
- Engagement and interaction rate
- Conclusions and action plan for the next reporting period
Let's take a closer look at each of the points.
1. Goals and objectives set for the current reporting period
Goals and objectives come from the social media strategy and are developed individually for each client, based on their business goals, niche and marketing budget. Examples of goals and objectives:
- "Multiply by 2 the engagement on the brand's Instagram account",
- “Reduce the cost of a click/application”,
- “Multiply by 3 the number of brand audiences”.
The community management report analyzes the result of these objectives over a given period to monitor progress.
2. Main Community statistics for the period
This is a part where the main figures are collected from the previous reporting period to the current reporting period.
For example: the account had 6000 followers on June 30th and 6100 on July 30th. Unsubscribes: -50. Growth: +100 per month. Net growth: +50 followers. Advertising spend to increase followers: €40. Cost per follower: €0,4. This is 30% cheaper than the previous month.
What indicators can be taken into account?
It all depends on the social media strategy. The most common KPIs in a social media specialist's community management report are:
- the number of subscribers;
- audience metrics (organic and/or paid);
- the ratio of audience involvement in the content. The calculation is based on the likes, comments, reposts, saves received;
- the number of clicks;
- the total reach of the page;
- total page impressions.
3. Content Statistics
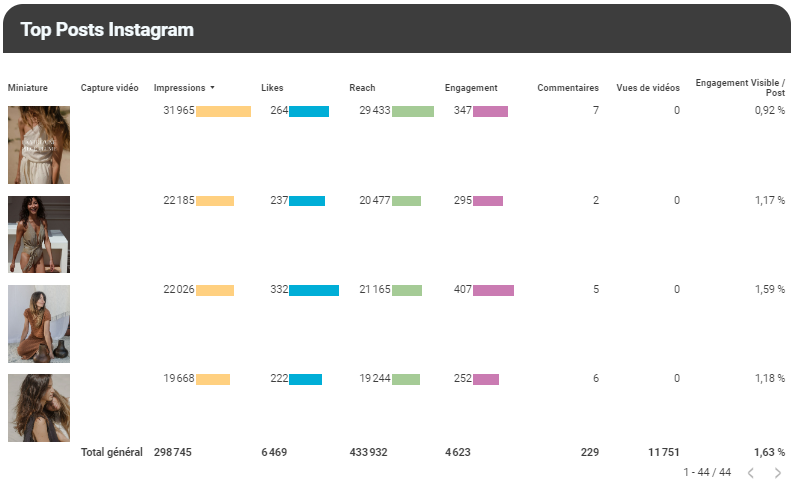
In this part of the community management report, the analysis of the best and worst posts is made. These conclusions are based on the coverage of the post, as well as the number of likes, comments, reposts and saves collected. Which topics have been commented on the most? Which posts got the most likes and saves?
4. Targeted Advertising Statistics
Here, the effectiveness of paid promotion is analyzed to determine the channels and tools used. How much was spent, what is received, what is the cost of an application, what percentage of targeted applications?
5. Community audience data, subscriber feedback
Internal statistics provide understandable figures on the socio-demographic profile of the community audience. Information such as: what is the gender, age of our audience, where they live. This block of the social media specialist's report also includes screenshots with comments and requests from the public during this reporting period.
Indeed, this allows the client to analyze audience feedback: on what subjects did subscribers contact the brand most often on social networks, what percentage of positive/neutral/negative comments, etc.
6. Conclusions and action plan for the next reporting period
Finally, there is a brief summary based on the figures from the reference period: what worked well closer to the objectives, and what can be improved. The report must contain a work plan for the following month: new hypotheses to be tested, new approaches and work mechanics.
For example : "We've seen a 50% increase in video engagement compared to last month. It seems videos are becoming increasingly effective, so we'll be producing more of them." Consequently, the next social media report should confirm whether this hypothesis holds true.
Why do a community management report with Datablaster?
Preparing a report requires processing large amounts of data. Tools like Datablaster , for collecting analyses and automatically preparing reports, help to make this task easier.
Indeed, Datablaster automatically collects and synthesizes data from your various social media accounts, formatting and presenting it in one place. Within your personal account, you can fully customize the report by selecting only the data you need. It works with all the major metrics: engagement, visit statistics, ad conversion rates, and more. Reports are ready to use, downloadable, and accessible from any device.
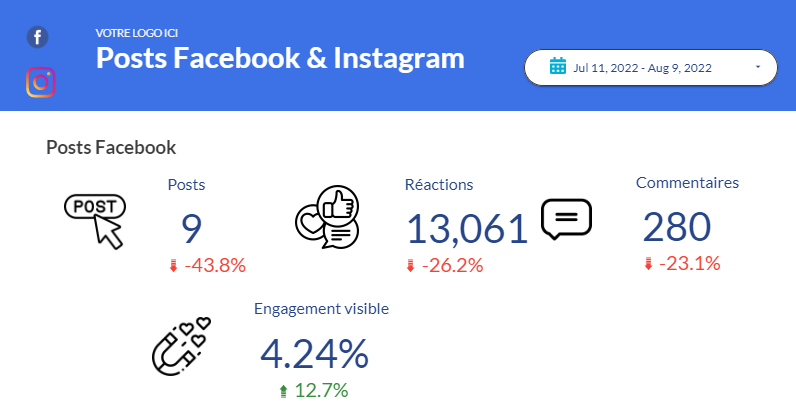
For example, this report compiles a page's Facebook and Instagram posts along with all associated metrics. It includes an automatic calculation of post engagement rate and community size.
You can create your reports using Google Sheets or Data Studio, depending on your preference. Both allow you to create PDFs, and you can automate report distribution in Data Studio.
It works with the most popular social networks such as Facebook, Instagram, and LinkedIn. Based on the data received, you can generate customized community management reports and automatically share them with your clients or superiors.
Community management report: conclusion
A competent social media report collects key metrics for the project, content analysis and audience feedback, paid promotion analysis, conclusions and recommendations for the next month. The report helps the client to get an idea of what is happening and the specialist to adjust his action plan to achieve the objectives of the social media strategy.
With Datablaster , say goodbye to navigating through multiple accounts to analyze results. Eliminate manual reporting and save countless hours each day with community management reports ready to be analyzed and sent to your clients.
